
Data · Listing Red-Flag Index
44% of 88 live business listings raise a high-severity red flag
Short answer: 44% of 88 public Empire Flippers listings we read (2026-10-14 to 2026-10-16) raised at least one high-severity flag, 54% showed a negative marketplace-reported revenue trend, and every one left customer or revenue concentration undisclosed. The median listing asked 2.4× annual profit, a payback of 28.8 months.
Key figures
- Listings read: 88 live Empire Flippers listings, asking $55,000 to $424,477 (median $175,934).
- Mix: 68 ecommerce, 14 content sites, 6 SaaS.
- At least one high-severity flag: 39 of 88 (44%).
- Negative marketplace-reported revenue trend: 47 of 87 (54%) that reported one.
- Median flags per listing (excluding information-only notes): 5.0.
- Median asking multiple: 2.4× annual profit; median payback 28.8 months.
Which red flags appear most often?
| Flag | Listings | Share |
|---|---|---|
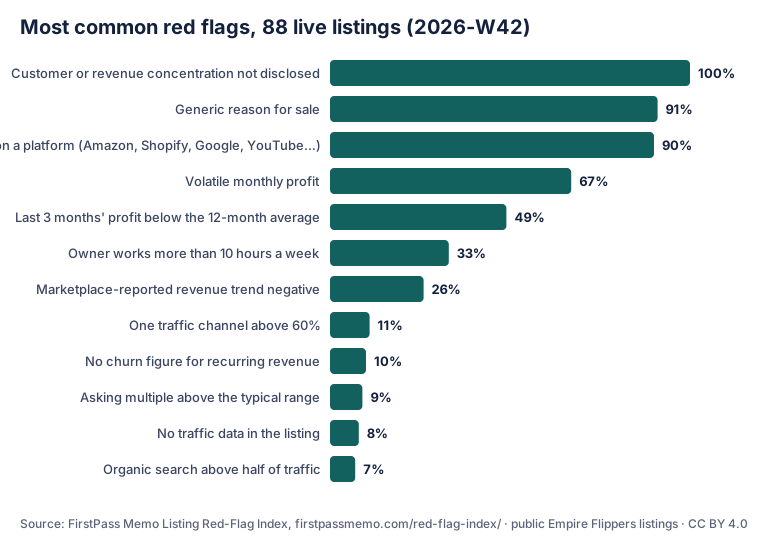
| Customer or revenue concentration not disclosed | 88 of 88 | 100% |
| Generic reason for sale | 80 of 88 | 91% |
| Relies on a platform (Amazon, Shopify, Google, YouTube…) | 79 of 88 | 90% |
| Volatile monthly profit | 59 of 88 | 67% |
| Last 3 months' profit below the 12-month average | 43 of 88 | 49% |
| Owner works more than 10 hours a week | 29 of 88 | 33% |
| Marketplace-reported revenue trend negative | 23 of 88 | 26% |
| One traffic channel above 60% | 10 of 88 | 11% |
| No churn figure for recurring revenue | 9 of 88 | 10% |
| Asking multiple above the typical range | 8 of 88 | 9% |
| No traffic data in the listing | 7 of 88 | 8% |
| Organic search above half of traffic | 6 of 88 | 7% |
By business type
| Type | Listings | Median multiple | Median payback |
|---|---|---|---|
| Ecommerce | 68 | 2.32× | 27.8 months |
| Content site | 14 | 2.4× | 28.8 months |
| SaaS | 6 | 2.73× | 32.8 months |
SaaS has only 6 listings in this edition, so treat its medians as indicative only.
Embed the chart
Journalists, newsletters and bloggers may use the chart and figures with a link back. Copy this HTML:
<a href="https://firstpassmemo.com/red-flag-index/"><img src="https://firstpassmemo.com/red-flag-index/chart.svg" width="760" alt="Most common red flags across 88 Empire Flippers listings, FirstPass Memo Listing Red-Flag Index 2026-W42"></a>
Suggested citation: FirstPass Memo, Listing Red-Flag Index 2026-W42, https://firstpassmemo.com/red-flag-index/ (CC BY 4.0).
Method
We read each listing's public page data on Empire Flippers between 2026-10-14 to 2026-10-16 and ran it through the same rules as our free checker, with a human review of each flag. Each listing has its own teardown page (see also famous-deal teardowns) so every count can be checked. Figures are asking prices and seller- or marketplace-reported numbers, not sale prices or verified results. A flag is a prompt for a question, not a finding of wrongdoing. Information-only notes (for example, which data providers a listing shows) are not counted as flags. Our separate benchmarks cover $10k–$150k listings on other marketplaces.
FAQ
How often is the index updated?
It is a weekly edition built from the teardowns live that week. Each edition is dated; figures are not revised after publication except for corrections, which we note.
Does a red flag mean a listing is a scam?
No. Most flags mean something is missing or needs explaining. Use them as questions for the seller.
Can I check my own listing?
Yes: paste it into the free checker. Sellers can use the seller pre-check.