
Data
What $10k–$150k online-business listings ask: payback and multiples, October 2026
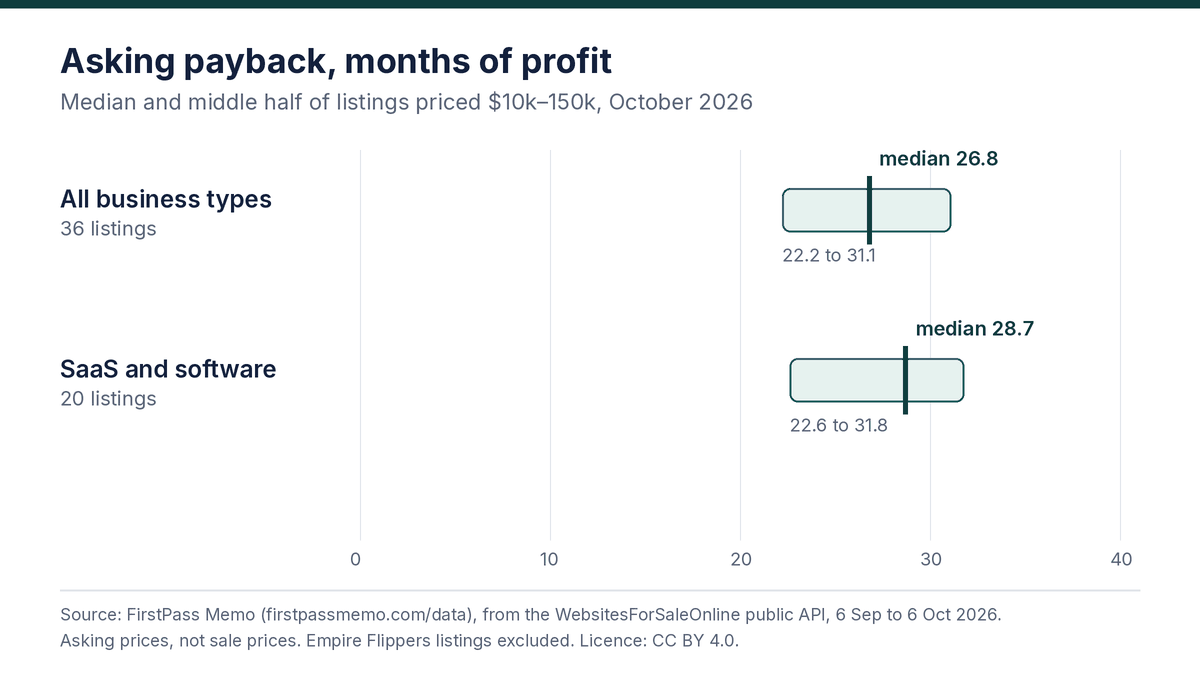
Short answer: FirstPass Memo's October 2026 benchmarks show online-business listings priced $10k–150k asking a median 26.8 months of profit (2.23 times annual profit) across 36 listings collected 6 September to 6 October 2026, Empire Flippers excluded. The middle half asked 22.2 to 31.1 months; SaaS and software listings asked a median 28.7 months.
The figures
| Business type | Listings | Median payback (months) | Middle half (months) | Median annual multiple | Middle half (multiple) | Median asking price | Under 12 months old |
|---|---|---|---|---|---|---|---|
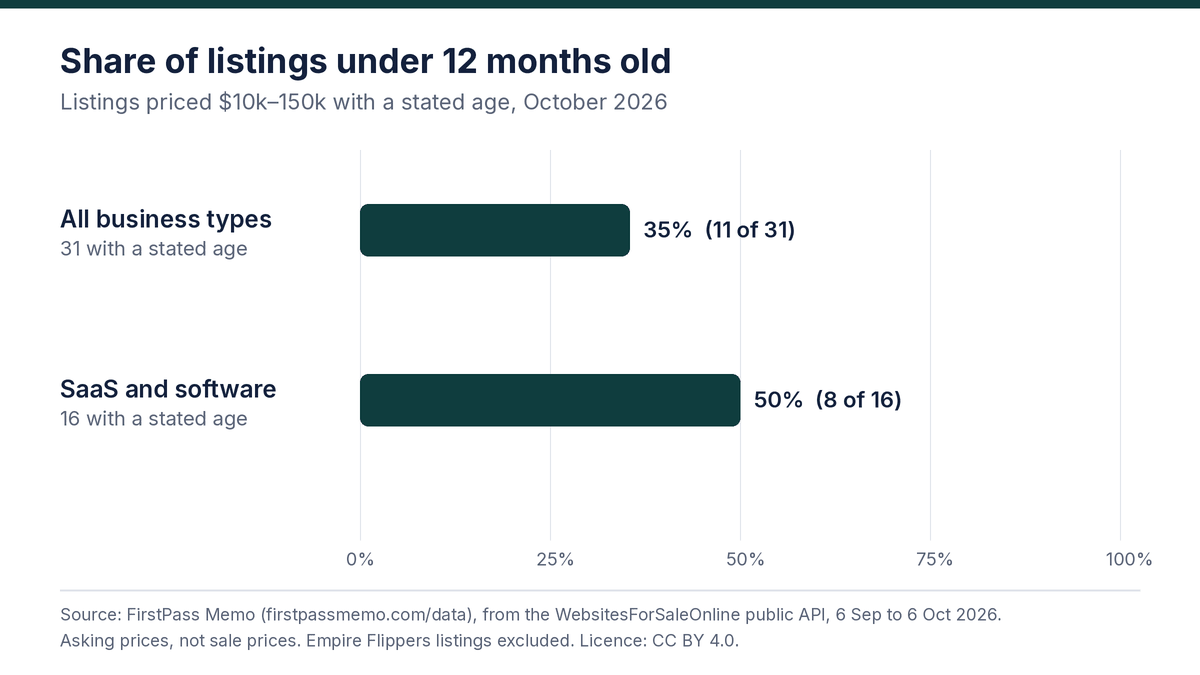
| All business types | 36 | 26.8 | 22.2–31.1 | 2.23× | 1.85–2.59× | $40,750 | 35% (11 of 31) |
| SaaS and software | 20 | 28.7 | 22.6–31.8 | 2.39× | 1.88–2.65× | $50,000 | 50% (8 of 16) |
| Mobile apps | 1 | Fewer than 8 listings; no figures published | |||||
| Content and affiliate sites | 3 | Fewer than 8 listings; no figures published | |||||
| Ecommerce and dropshipping | 3 | Fewer than 8 listings; no figures published | |||||
| YouTube channels | 6 | Fewer than 8 listings; no figures published | |||||
| Amazon FBA and FBM | 1 | Fewer than 8 listings; no figures published | |||||
| Newsletters | 0 | Fewer than 8 listings; no figures published | |||||
Payback = asking price ÷ stated monthly profit. Annual multiple = payback ÷ 12. "Middle half" is the 25th to 75th percentile. Listings by marketplace in the all-types row: TrustMRR 29, Flippa 5, Motion Invest 2.
Charts
What stands out
- Most listings ask about two years of profit. Half of all listings asked between 22.2 and 31.1 months. A listing asking far more than that should be able to show why; one asking far less often has a reason too. The priced below one year of profit page covers the low end.
- Many listings are young. 11 of the 31 listings with a stated age were under a year old, and 9 were under six months. See under 6 months of history.
- High margins are common. 12 of the 36 listings stated a profit margin above 90%, and 1 showed profit above revenue. Margins that high usually leave costs out. See a margin above 90%.
- The sample leans towards small software. 29 of the 36 listings came from TrustMRR, so treat the all-types figures as a rough guide for content sites, stores and other types.
How often does each red flag fire in these listings?
At least 10 of the 36 listings in the October 2026 sample raised a high-severity flag in the FirstPass Memo red-flag checker, and 27 raised at least one flag, counting only the rules we could measure from the listing summaries. The most common were a margin above 90% (12 of 36) and less than six months of history (9 of 36).
| Rule | Group | All types (36 listings) | SaaS and software (20) |
|---|---|---|---|
| No asking price | Price and earnings | 0 (filtered out) | 0 (filtered out) |
| No profit figure | Price and earnings | 0 (filtered out) | 0 (filtered out) |
| Zero or negative profit | Price and earnings | 0 (filtered out) | 0 (filtered out) |
| Priced below one year of profit | Price and earnings | 1 of 36 (3%) | 0 of 20 (0%) |
| Multiple above the typical range | Price and earnings | not published | not published |
| Last month at or below zero | Trend | none seen in 36 summaries | none seen in 20 summaries |
| Last month below the average | Trend | none seen in 36 summaries | none seen in 20 summaries |
| Revenue declining | Trend | none seen in 36 summaries | none seen in 20 summaries |
| Short averaging window | Trend | at least 1 of 36 | none seen in 20 summaries |
| ARR and MRR disagree | Numbers that disagree | none seen in 36 summaries | none seen in 20 summaries |
| ARR far above trailing revenue | Numbers that disagree | none seen in 36 summaries | none seen in 20 summaries |
| MRR above collected revenue | Numbers that disagree | none seen in 36 summaries | none seen in 20 summaries |
| Monthly and annual revenue disagree | Numbers that disagree | none seen in 36 summaries | none seen in 20 summaries |
| Profit higher than revenue | Numbers that disagree | 1 of 36 (3%) | 0 of 20 (0%) |
| Margin above 90% | Numbers that disagree | 12 of 36 (33%) | 7 of 20 (35%) |
| No churn figure | Customers and retention | not measured | not measured |
| Churn above 5% a month | Customers and retention | none seen in 36 summaries | none seen in 20 summaries |
| Few paying customers | Customers and retention | none seen in 36 summaries | none seen in 20 summaries |
| Top customer above 25% | Customers and retention | none seen in 36 summaries | none seen in 20 summaries |
| Concentration not disclosed | Customers and retention | not measured | not measured |
| Search-dependent traffic | Traffic and platforms | none seen in 36 summaries | none seen in 20 summaries |
| One channel above 60% | Traffic and platforms | none seen in 36 summaries | none seen in 20 summaries |
| SEO claim versus the data | Traffic and platforms | none seen in 36 summaries | none seen in 20 summaries |
| Platform dependence | Traffic and platforms | at least 8 of 36 | at least 2 of 20 |
| No traffic data | Traffic and platforms | not measured | not measured |
| No connected data source | Verification, age and operations | not measured | not measured |
| Business age not stated | Verification, age and operations | 5 of 36 (14%) | 4 of 20 (20%) |
| Under 6 months old | Verification, age and operations | 9 of 36 (25%) | 7 of 20 (35%) |
| Under 12 months old | Verification, age and operations | 2 of 36 (6%) | 1 of 20 (5%) |
| Owner hours not stated | Verification, age and operations | not measured | not measured |
| More than 10 hours a week | Verification, age and operations | none seen in 36 summaries | none seen in 20 summaries |
| Passive, but staffed | Verification, age and operations | none seen in 36 summaries | none seen in 20 summaries |
| Generic reason for sale | Verification, age and operations | none seen in 36 summaries | none seen in 20 summaries |
Each listing ran through the red-flag checker with its stated price, profit, revenue and age plus the short description the aggregator carries. "Not measured": the rule fires when something is missing, and a truncated summary cannot show that. "At least": the rule fires on something stated in the text, and full listings may say more. "Not published": the rule compares with Empire Flippers ranges. On the rules we could measure, at least 10 of 36 listings raised a high-severity flag and 27 raised at least one flag. Same sample, method and licence as the October 2026 benchmarks.
Is this data available as JSON?
Yes. /data/latest.json always holds the newest edition, and /data/benchmarks-2026-10.json is the dated October 2026 edition. Both carry the same aggregates as the CSV plus the flag-frequency table, under CC BY 4.0, and can be fetched from other sites (CORS open).
| Field | Meaning |
|---|---|
name, edition, published, updated | Title and dates of this edition |
url, license, cite | Page, licence (CC BY 4.0) and how to cite |
source, window, filter, min_group_size | Where the listings came from, when, which ones and the smallest group with figures |
groups[] | One object per business type with the fields below (the same columns as the CSV) |
groups[].group | Business type |
groups[].listings | Listings in the group after the filter |
groups[].median_payback_months | Median asking price ÷ stated monthly profit |
groups[].payback_p25_months | 25th percentile of payback |
groups[].payback_p75_months | 75th percentile of payback |
groups[].median_annual_multiple | Median asking price ÷ stated annual profit |
groups[].multiple_p25 | 25th percentile of the annual multiple |
groups[].multiple_p75 | 75th percentile of the annual multiple |
groups[].median_asking_price_usd | Median asking price in US dollars |
groups[].listings_with_stated_age | Listings that state a business age |
groups[].under_12_months_old | Of those, listings under 12 months old |
groups[].share_under_12_months | under_12_months_old ÷ listings_with_stated_age |
groups[].note | Why figures are missing, if they are |
flag_frequency.totals | Listings measured, listings raising any high-severity flag, listings raising any flag, for all types and for SaaS and software |
flag_frequency.rules[].code | Checker rule code, as in /rules.json |
flag_frequency.rules[].status | measured, at_least, absence (not measured), excluded (not published) or filtered (removed by the sample filter) |
flag_frequency.rules[].all / .software | Listings raising the rule; null when not measured or not published |
Cite this
FirstPass Memo. What $10k–$150k online-business listings ask: payback and multiples, October 2026. https://firstpassmemo.com/data/ (accessed [date]). Based on WebsitesForSaleOnline public API data, 2026-09-06 to 2026-10-06. CC BY 4.0.
Our aggregates are free to reuse under CC BY 4.0: credit FirstPass Memo and link to this page. The charts carry the credit in the image.
Method
- Source. The public API of WebsitesForSaleOnline (/api/v1/deals), which lists deals featured from several marketplaces. We collected its daily lists from 6 September to 6 October 2026, at a gentle request rate, under its terms for research and analysis.
- Filter. Asking price $10,000 to $150,000; stated monthly profit above zero. Empire Flippers listings are excluded, because its API terms do not allow us to publish figures from it.
- Counting. The source gives a listing a new id each day, so we match listings by title (a generic title such as "anonymous startup" is split by stated age) and count each listing once, at its latest price in the window.
- Figures. Medians and quartiles (inclusive method) of asking price ÷ stated monthly profit. Age is the seller's stated business age.
- Small groups. We publish figures only for groups of at least 8 listings. Smaller groups show a count only.
- Limits. These are asking prices and seller-stated profit, not sale prices or verified figures. The sample is what one aggregator featured in one month, not every listing on the market.
- What we publish. Aggregates only: no listing rows, names or links.
Changelog
- 7 October 2026, later the same day. Added the flag-frequency table and the JSON files (latest.json and benchmarks-2026-10.json). The benchmark figures did not change.
- 7 October 2026. First publication. This also corrects the counting behind the benchmark boxes on our "Is it worth it?" pages, first published the same day: a listing whose price changed during the window had been counted once per price. The all-types count fell from 45 to 36 and software from 35 to 20; the all-types median moved from 26.7 to 26.8 months and software from 27.1 to 28.7.
Related
- Red flags explained: one page for each rule in the free checker.
- True payback calculator: payback after the owner's time and missing costs.
- Is it worth it? By business type
Informational only, not investment or valuation advice. WebsitesForSaleOnline is not affiliated with FirstPass Memo and has not reviewed these figures. Corrections: hello@firstpassmemo.com.