
This week's listing roast · week of 19 Oct 2026
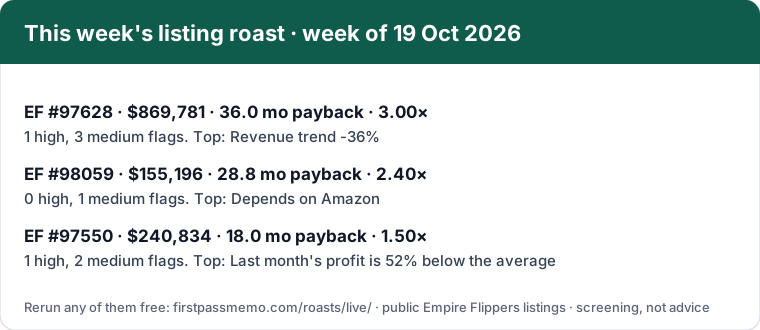
This week's listing roast: three new Empire Flippers listings through the 33-rule checker
Three public listings that went up on Empire Flippers on 16 Oct 2026, run through the same 33 published rules as the free checker. Every flag links to its rule, every figure comes from the listing, and every listing has a link that reruns the check in your browser so you can see it for yourself.
- EF #97628: $870K supplement subscription: revenue down 36%, priced above the range
- EF #98059: $155K auto-parts brand: the listing disagrees with itself on age and hours
- EF #97550: $241K dropshipping wholesaler at 1.5×: cheap, with very uneven months
Flags are prompts for questions, not accusations; most listings are incomplete rather than dishonest. Figures are seller-reported and as published by the marketplace; nothing here is verified diligence or advice. Not affiliated with Empire Flippers.
Roast 1 of 3 · Empire Flippers #97628
$870K supplement subscription: revenue down 36%, priced above the range
Checker result: 1 high, 3 medium, 2 low flags. Payback 36.0 months, 3.00× annual profit.
| Asking price | $869,781 |
|---|---|
| Average monthly profit (12 months) | $24,161 |
| Average monthly revenue | $44,799 |
| Payback | 36.0 months |
| Asking multiple | 3.00× annual profit (typical 2.06×–2.85× for Subscription, n=14) |
| Last reported month | $21,080 profit (Sep 2026) |
| Revenue trend (EF) | -36% over 12 months |
| First made money | Jun 2019 |
| Owner hours (data field) | 25 a week |
| Monthly churn | 3.82% |
| Model | Subscription, eCommerce, Amazon FBA |
What the reviewer noticed
- Empire Flippers' own trend figures show revenue down 36% and profit down 33% over 12 months.
- Payback is 36.0 months on the 12-month average profit ($24,161), but 41.4 months on the last three months' average ($20,988).
- The listing says a mid-2026 inventory gap followed changes to Amazon's services and has since been resolved. Most inventory is kept in a home office and local self-storage, and inventory is not normally included in the price. Ask what moves at handover and what the stock costs.
Flags from the 33 rules
High Revenue trend -36%
The listing reports a decline of this size. Declines tend to continue after a sale unless the cause is known and fixable.
Ask the seller: What is causing the decline, what has been tried, and what do the last three months look like?
Needs the full-figures link.
Medium Depends on Amazon
The listing relies on a platform the buyer does not control. A policy, fee, algorithm or account change there can cut revenue quickly.
Ask the seller: Has the Amazon account ever had a suspension, listing removal or policy warning, and what share of revenue would stop if it did?
Needs the full-figures link.
Medium Asking multiple 3.00× is above the typical range
Comparable listings ask 2.06×–2.85× annual profit (middle half, n=14). A higher price can be fair, but only with evidence such as growth or proven retention.
Ask the seller: What justifies pricing above comparable listings: growth, verified retention, or something else you can document?
Shows in the quick link too.
Medium Seller reports 25 hours a week
That time either becomes your job or a cost you pay someone else, which lowers the real profit.
Ask the seller: Which tasks take the time, and what would it cost to hand them to a contractor?
Shows in the quick link too.
Low Concentration not disclosed
The listing does not say how much revenue comes from the largest customer, affiliate program or traffic partner.
Ask the seller: What share of revenue comes from the top 1 and top 3 customers or partners?
Shows in the quick link too.
A vague reason is common, but worth a direct question.
Ask the seller: Why sell now, and what would you do with the business if it does not sell?
Needs the full-figures link.
The quick link also shows “No connected data source mentioned”, because a link made of numbers cannot say that the listing has connected data (Amazon Seller Central, Shopify, Stripe). The full-figures link includes it, so that flag drops out there.
Rerun the quick check Rerun with every figure above
Quick link: firstpassmemo.com/checker/?ask=869781&profit=24161&revenue=44799&age=88&hours=25&type=subscription&churn=3.82&via=roast-live. Source: Empire Flippers #97628, public listing first listed Oct 16, 2026; figures read from the Empire Flippers public API on 18 Oct 2026 (CT).
Roast 2 of 3 · Empire Flippers #98059
$155K auto-parts brand: the listing disagrees with itself on age and hours
Checker result: 0 high, 1 medium, 2 low flags. Payback 28.8 months, 2.40× annual profit.
| Asking price | $155,196 |
|---|---|
| Average monthly profit (12 months) | $5,389 |
| Average monthly revenue | $21,280 |
| Payback | 28.8 months |
| Asking multiple | 2.40× annual profit (typical 2.21×–2.92× for Amazon FBA, n=76) |
| Last reported month | $4,505 profit (Sep 2026) |
| Revenue trend (EF) | +10% over 11 months |
| First made money | Nov 2023 |
| Owner hours (data field) | 8 a week |
| Model | Amazon FBA, eCommerce |
What the reviewer noticed
- The summary says the business was “first monetized in November 2021”; the listing's data field says Nov 2023. The checker uses the data field (35 months). Ask which is right; it changes how many seasons the numbers cover.
- The summary says the seller works “approximately 7-8 hours a month”; the data field says 8 hours a week. Ask for a task-by-task time log.
- Amazon is “approximately over a third” of revenue and four eBay accounts about 25%. The listing's own disclaimer says eBay forbids account transfers and the buyer carries that risk.
- The 12-month average profit is $5,389; the last three months averaged $4,346 (35.7 months' payback, against 28.8 stated).
Flags from the 33 rules
Medium Depends on Amazon
The listing relies on a platform the buyer does not control. A policy, fee, algorithm or account change there can cut revenue quickly.
Ask the seller: Has the Amazon account ever had a suspension, listing removal or policy warning, and what share of revenue would stop if it did?
Shows in the quick link too.
Low Concentration not disclosed
The listing does not say how much revenue comes from the largest customer, affiliate program or traffic partner.
Ask the seller: What share of revenue comes from the top 1 and top 3 customers or partners?
Shows in the quick link too.
A vague reason is common, but worth a direct question.
Ask the seller: Why sell now, and what would you do with the business if it does not sell?
Needs the full-figures link.
The quick link also shows “No connected data source mentioned”, because a link made of numbers cannot say that the listing has connected data (Amazon Seller Central, Shopify, Google Analytics). The full-figures link includes it, so that flag drops out there.
Rerun the quick check Rerun with every figure above
Quick link: firstpassmemo.com/checker/?ask=155196&profit=5389&revenue=21280&age=35&hours=8&type=fba&via=roast-live. Source: Empire Flippers #98059, public listing first listed Oct 16, 2026; figures read from the Empire Flippers public API on 18 Oct 2026 (CT). Read the full teardown.
Roast 3 of 3 · Empire Flippers #97550
$241K dropshipping wholesaler at 1.5×: cheap, with very uneven months
Checker result: 1 high, 2 medium, 2 low flags. Payback 18.0 months, 1.50× annual profit.
| Asking price | $240,834 |
|---|---|
| Average monthly profit (12 months) | $13,380 |
| Average monthly revenue | $29,246 |
| Payback | 18.0 months |
| Asking multiple | 1.50× annual profit (typical 2.08×–2.83× for eCommerce, n=51) |
| Last reported month | $6,380 profit (Aug 2026) |
| Revenue trend (EF) | +148% over 12 months |
| First made money | Sep 2024 |
| Owner hours (data field) | 12 a week |
| Model | eCommerce, DropShipping |
What the reviewer noticed
- Monthly profit in the listing ranges from $3,023 (Jun 2026) to $42,008 (Oct 2025).
- The price is set on the 12-month average of $13,380. The last six months averaged $6,252, which puts payback at 38.5 months instead of 18.0.
- The seller also sells individual brands; the listing says brand-sale proceeds are excluded from the valuation. Ask how many brands were sold in the last 12 months and what revenue left with them.
- No connected data sources are listed for this one, so every figure is seller-reported until you see the accounts.
Flags from the 33 rules
High Last month's profit is 52% below the average
Last month $6,380 against an average of $13,380. A price set on the average overstates what the business earns now.
Ask the seller: What pushed last month below the average, and is it a one-off or a trend?
Needs the full-figures link.
Medium Seller reports 12 hours a week
That time either becomes your job or a cost you pay someone else, which lowers the real profit.
Ask the seller: Which tasks take the time, and what would it cost to hand them to a contractor?
Shows in the quick link too.
Medium No connected data source mentioned
The figures appear to be typed in by the seller. Nothing in the text says revenue or traffic is connected from Stripe, PayPal, analytics or a marketplace check.
Ask the seller: Can you give read-only access to the payment processor and analytics, or exports that match the P&L?
Shows in the quick link too.
Low Concentration not disclosed
The listing does not say how much revenue comes from the largest customer, affiliate program or traffic partner.
Ask the seller: What share of revenue comes from the top 1 and top 3 customers or partners?
Shows in the quick link too.
A vague reason is common, but worth a direct question.
Ask the seller: Why sell now, and what would you do with the business if it does not sell?
Needs the full-figures link.
Info Asking multiple 1.50× is below the typical range
Below the middle half of comparable listings. Cheap can be good, or it can price in a problem.
Shows in the quick link too.
Rerun the quick check Rerun with every figure above
Quick link: firstpassmemo.com/checker/?ask=240834&profit=13380&revenue=29246&age=25&hours=12&type=ecommerce&via=roast-live. Source: Empire Flippers #97550, public listing first listed Oct 16, 2026; figures read from the Empire Flippers public API on 18 Oct 2026 (CT). Read the full teardown.
Share or embed this roast
Link: https://firstpassmemo.com/roasts/live/
Embed the summary card on your site, newsletter or forum post (free to reuse with the link back):
<a href="https://firstpassmemo.com/roasts/live/?utm_source=roast-embed"><img src="https://firstpassmemo.com/roasts/live/card.svg" width="760" alt="This week's listing roast: three public Empire Flippers listings through the FirstPass Memo 33-rule checker"></a>
Want a ready-made check for a listing you are writing about? Use firstpassmemo.com/checker/?ask=PRICE&profit=MONTHLY_PROFIT and add hours, churn, age or type if you have them. How check links work.
Roast the listing you are looking at
Paste it into the checker. It runs in your browser, nothing is sent, and every flag comes with the question to put to the seller. Want the full first pass on one listing? A memo is $79, paid only after it is delivered. More: six video roasts · teardowns · the weekly Red-Flag Index.